Its been about a year since I last looked at what the cost of cloud vs on-premise compute is, if you are interested you can find the comparison here.
Last year we focused on two cloud architectures and three different on-premise deployment styles. This year we have gone a step further; because of the advancements in the software that you can deploy the functionality of on-premise platforms has increased drastically.
The two main comparisons we have on-premise include network virtualisation, network micro-segmentation, full show-back capabilities and full workload automation. Obviously, these come at a price, but given the way the world has shifted across the board, costs have changed.
To allow us to compare the two years together, the sizing for the infrastructure has stayed roughly the same:
- 600 virtual machines
- 4 vCPUs per virtual machine
- 16GB RAM per virtual machine
- 256GB storage per virtual machine (a slight shift from last year but easier to do with the cloud costs)
This year we have also decided to provide a slightly different comparison. We still have the two different cloud areas, UK and Europe, and we still have the 3 tier and hyper converged on-premise as well, however for this year we have included a traditional design costing.
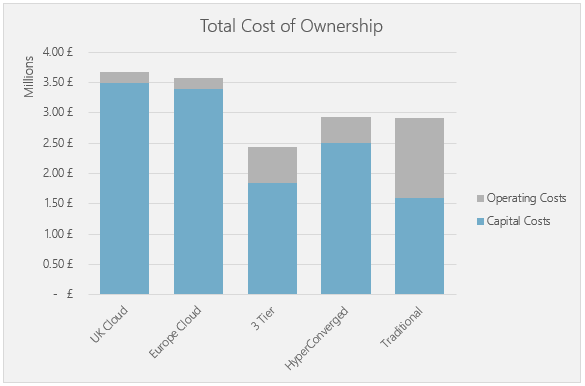
The headline figures are interesting; even with additional functionality all of the on-premise costs have dropped. The same can be said for the cloud costs, given how new the UK instances were last year the costs here have dropped drastically.
Once again, we have used reserved instances for the cloud costings, which is the scenario that would be the most cost-effective in a lift and shift style move, as these can see a cost reduction of up to 30% in some instances.
If you apply a different style of migration you would end up with a very different graph; the cloud becomes much more cost-efficient if you start leveraging the additional services, auto-scaling instances, rapid scaling etc. However, these services require a much more complex migration.
With the on-premise environment, we have assumed that all of the designs will be built with N+1 resiliency, as you would expect with an enterprise environment. This year, due to the increased amount of software included, we have included a separate management cluster to run all of the management infrastructure on.
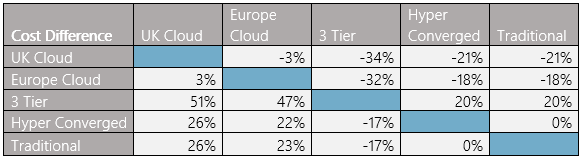
I appreciate that the way the scale looks on the graph it can be a little challenging to see what the differences are; therefore, we have produced a handy comparison table which makes it a little clearer:
So, what does all of this actually mean? Does it mean that putting workloads in the cloud is a bad idea?
Not at all.
What it means is that the cloud should be used when it allows you to augment your on-premise capabilities. Every workload has its own characteristics and requirements and it should be based on this mix that you select the best place.
For example, if you are using VDI, but it's only used 9-5 in the UK, you could utilise the cloud and auto scale sets to allow you to reduce your cost during the night - whilst still giving you the number of VMs you need during the day. The other option is that you re-architect your applications to take advantage of PaaS and SaaS technologies. If you can do this you can expect the costings illustrated above to drastically change.
In order to provide total transparency to you, the following has been used to provide the above costings*:
- 600 virtual machines
- Each VM with 4 vCPUs, 16GB RAM, 256GB of storage
- All storage is all flash
- N+1 resiliency as a minimum
- A single site or region is assumed
- No costs for disaster recovery are included
- No costs for backup are included
- No costs for security are included
- All server and storage connectivity is 10Gb as a minimum
If you would like us to help you build a TCO for your own environment then please get in contact with your account manager, or drop us an email.